| Ekoportal |
|---|
|
|
Biogenic substances in fresh water
A brief summary
Average concentrations of nitrate and phosphate in lakes/reservoirs and rivers have decreased significantly since 2009-2012. The concentration in the lakes was still higher at the end than at the beginning of the time series.
Phosphate concentrations in rivers have increased significantly since the beginning of the time interval, although they have been more stable and decreased in subsequent years.
Current (2016-2017) nitrogen and phosphate concentrations were generally low, but slightly higher for lakes and reservoirs than for rivers
Are the concentrations of nutrients decreasing in the surface waters of the Republic of Azerbaijan?
Surface water nutrients (2001-2017)
Phosphate concentration in rivers across the country

Phosphate concentration in rivers by region
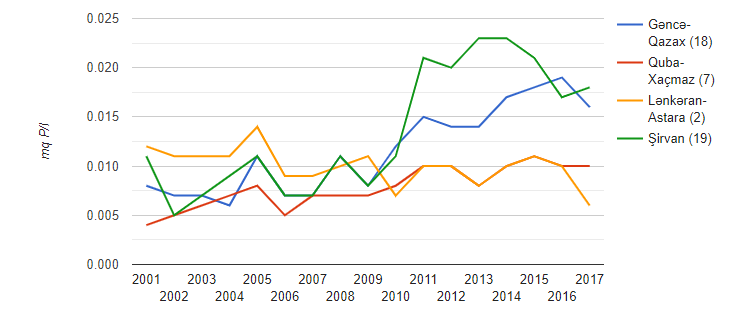
Nitrate concentration in rivers across the country

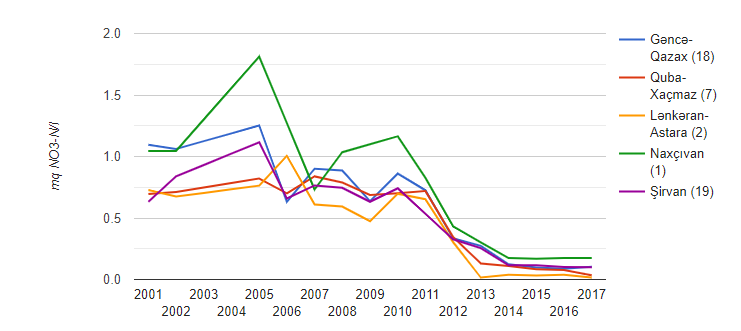
Concentration of nitrate in rivers by region
Concentration of phosphate in lakes and reservoirs

Concentration of nitrate in lakes and reservoirs
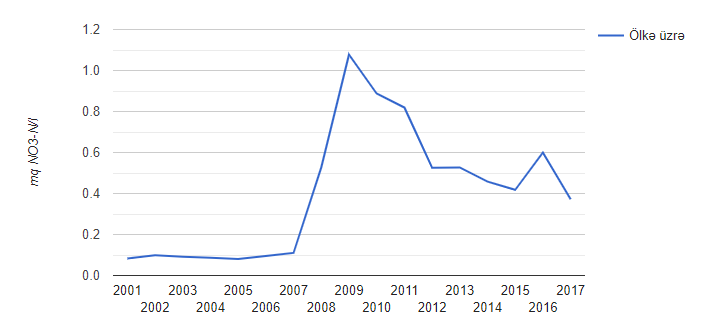
Note: data for the years 2001-2017 are the average annual indicator of phosphate (above) concentration (mg P/l) and nitrogen (below) concentration ( mg NO3-N/l) was calculated. As for lakes and reservoirs, the average annual indicator of phosphate (left) concentration (mg P/l) and nitrogen (right) average annual indicator (mg NO3-N/ l) calculated as The number of monitoring points for both pollutants is 8.
Since 2012, there has been a downward trend in the average concentration of phosphate in rivers across the country. However, the average concentration was twice as high in the following years as compared to the previous years. The concentration in Ganja-Gazakh region and especially in Shirvan increased from 2009 to 2011. Concentrations in the Ganja-Gazakh zone continued to increase steadily after that. A slower but steady growth is observed for the Guba-Khachmaz region.
The average concentration of nitrate in rivers has decreased during the studied period and especially since 2011, reaching its lowest level since 2014. The trend is quite similar between different regions, but in previous years nitrogen concentration was higher in Ganja-Gazakh and Shirvan than in Guba-Khachmaz and Lankaran-Astara. The highest levels were observed in Nakhchivan, but this region was represented by only one monitoring site.
Phosphate concentration in lakes and water reservoirs increased significantly starting from 2009 and then decreased. The level of concentration has increased throughout the period, the concentrations have increased by 1.5 times in recent years compared to previous years.
Regarding nitrate, the concentration for lakes and reservoirs is different from that seen for rivers, where the lowest concentrations were observed at the beginning of the time series. Before the increase observed in the lakes, the average concentration increased somewhat sharply, but since 2009 it has halved. Still, current levels are nearly four times higher than in previous years.
What is the current situation of concentration of nutrients in groundwater of the Republic of Azerbaijan?
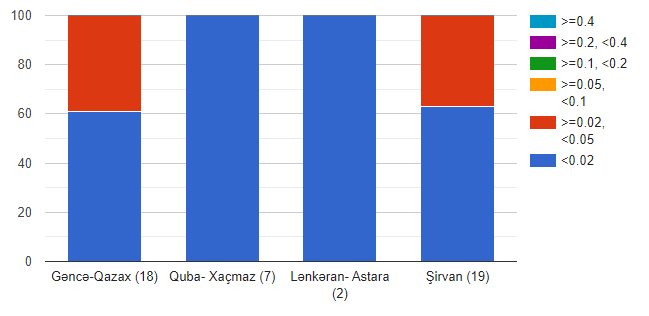
Phosphate concentration in rivers (2017)
Concentration of phosphate and nitrate in lakes (2017)
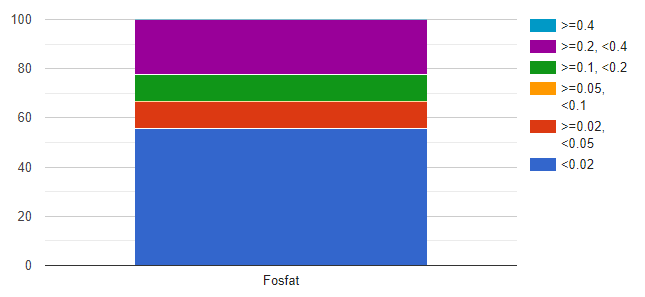
Phosphate concentration in lakes/reservoirs (mg P/l)
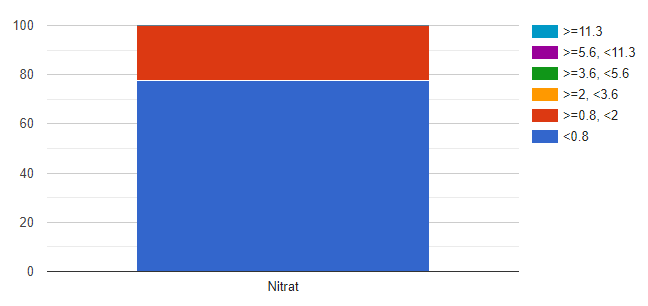
Nitrate concentration in lakes/reservoirs (mg NO3-N/l)
Features of the indicator
Description of the pointer
Concentrations of phosphates and nitrates in rivers and lakes (phosphate was used instead of total phosphorus in lakes)
Units
The concentration of phosphates and total phosphorus is expressed in mg P / liter, the concentration of nitrates is expressed in mg NO3-N / liter.
Justification
Rationale for indicator selection
Agriculture is widely developed in the country's river basins. As a result of the use of fertilizers in agricultural fields, nitrogen and phosphorus wastes into water bodies have a negative effect on aquatic flora and fauna and create certain problems related to the use of water for drinking water purposes.
Good environmental conditions related to the concentration of nutrients in surface waters are important to meet the requirements of national environmental legislation and related EU directives: Water Framework Directive, Urban Wastewater Treatment Directive.
Compared to other countries in the South Caucasus, Azerbaijan's water resources are limited and make up only 15 percent of all water resources in the region. The sources of surface water resources of the country are rivers, lakes, reservoirs and glaciers. Azerbaijan is a severely water-stressed country with limited water resources, with a long-term average annual water use index (WEI) of more than 53.1% (WEI = 78.4% in 2019). (See indicators C2 and C3 for more details).
There are 21 transboundary rivers in the country, and most of them are located in the Kura and Araz river basins. The basins of Kura and Araz rivers are located in three and four countries, respectively.
After joining the UNECE Helsinki Convention on the Protection and Use of Transboundary Watercourses and International Lakes, water quality control activities in the main transboundary rivers, the Kura and Araz rivers, have been established in accordance with international standards.
Given the level of water pollution that already exists in upstream countries, water quality monitoring in Azerbaijan is extremely important. For this purpose, analytical laboratories were established in Gazakh, Beylagan and Neftchala regions, the purpose of which is to carry out monitoring activities in Kura and Araz rivers and their cross-border branches.
Scientific references
- European Union Council Directive of 21 May 1991 - on urban waste water treatment
- Directive 2000/60/EC of the European Parliament and of the Council of 23 October 2000 establishing a framework for Community action in the field of water policy (Water Framework Directive) http://ec.europa.eu/environment/water/waterframework/index_en.html ;
- UNECE Convention on the Protection and Use of Transboundary Watercourses and International Lakes (1992)
Current phosphate and nitrate concentrations were generally low in the river areas of Azerbaijan and slightly lower than the national maximum allowed concentrations (1.1 mg P/l and 10 mg NO3-N/l, respectively). In the Gazakh-Ganja and Shirvan regions, about 40% of the areas have a phosphate concentration in the range of 0.02-0.05 mg P / l. In case of increased phosphate concentration, special attention should be paid to these areas. Nitrate concentration was always below 0.2 mg NO3-N / l.
Although slightly higher than rivers, low nitrate concentrations were also found in lakes and reservoirs. The concentration of Lake Shabran and Lake Jandar was above 0.8 mg NO3-N/l, and only Jeyranbatan reservoir was below 0.2 mg NO3-N/l. For phosphate, the difference was greater, with 30% of stations above 0.1 mg P/l. This represents only three sites (Buyukshor, Lake Shabran and Lake Yasamal), but for these sites phosphate levels are high enough to cause eutrophication.
Political context and objectives
A description of the context
National political context
"The State Program of Socio-Economic Development of the Regions of the Republic of Azerbaijan in 2019-2023" declares the goal of protecting the environment and ensuring water purity. "Water Code of the Republic of Azerbaijan" describes the principles of management, monitoring, use and protection of water bodies. Article 81 states that "All waters (water bodies) may harm the health of the population as a result of changes in their physical, chemical, biological properties, reduction of natural purification capacity, violation of the hydrological and hydrogeological regime of waters, as well as fish and other aquatic bioresources . should be protected and protected from pollution, littering, depletion, which may lead to decrease, deterioration of water supply conditions and other unfavorable conditions. Article 78 sets limits on sewage discharge.
The National Program on water supply and sanitation aims to provide the population with a water supply and sanitation system that meets international standards. Since 1995, the program has made significant progress, particularly in urban water quality.
Currently, the Strategy of the Republic of Azerbaijan on the integrated management of water resources is being developed. The goal of the National Water Strategy (NWS) is the development of water resources management and water protection, water supply and sanitation in Azerbaijan to better meet both international and EU level standards and targets. In the initial draft of the strategy, there are goals divided into short-term (6 years), medium-term (18 years) and long-term periods. In the strategy project, there are goals divided into short-term (6 years), medium-term (18 years) and long-term goals.
In accordance with the Water and Health Protocol, the joint work of "Targeted Indicators" with relevant state institutions is continued. In this regard, with the provisions of the Water Convention and its Water and Health Protocol, targeted indicators were developed and approved by the Joint Order of the Ministry of Health and the Ministry of Ecology and Natural Resources.
International political context
The Convention on the Conservation and Use of Transboundary Watercourses and International Lakes (Water Convention) aims to ensure sustainable use of transboundary water resources by facilitating cooperation. The Water Convention strengthens transboundary water cooperation and measures for the environmentally sound management and protection of transboundary surface waters and groundwater.
Targets
National Political Goals
The main goal and the national water policy is to ensure sufficient quality water for human needs and the environment throughout the country.
The national maximum permissible concentrations are as follows:
BOT: 3.5 mg PO4 / l (1.1 mg P / l)
Ammonium: 45 mg NO3 / l (10 mg NO3-N / l)
International goals
UN Sustainable Development Goal target 6.3 aims to reduce pollution by 2030, eliminate and minimize the discharge of harmful chemicals and materials, reduce the proportion of untreated wastewater and achieve improved water quality through recycling and safe reuse globally .
Relevant political documents
- State Program of socio-economic development of the regions of the Republic of Azerbaijan in 2019-2023
- Water Code of the Republic of Azerbaijan
UNECE Convention on the Protection and Use of Transboundary Watercourses and International Lakes
Methodology
Methodology for calculating the indicator
After joining the UNECE Convention on the Protection and Use of Transboundary Watercourses and International Lakes, water quality control measures in the main transboundary rivers, the Kura and Araz rivers, have met international standards. Operational monitoring in both rivers was carried out according to the guidelines "Monitoring and assessment of transboundary watercourses and international lakes" developed by a group of qualified UN experts. Analytical research laboratories equipped with equipment for monitoring these rivers and their transboundary areas at the level of modern requirements were created in the Gazakh and Beylagan regions, taking into account that the Kura and Araz rivers pass through the neighboring states and are exposed to more pollution.
The monitoring program includes monitoring stations on 47 rivers and 10 lakes/reservoirs. Annual trends for each location are calculated by averaging the values of individual samples per year. Aggregate data are calculated as the average of individual annual trends. Only time series completed after gap filling are included in the aggregate time series. This is to ensure that the aggregate data series are consistent, meaning that there are identical points throughout the time series. In this way, estimates are not based on actual changes in concentration and changes in the number of stations. Time series were calculated for the whole country and only for rivers (pooled for Kazakh-Ganja, Guba-Khachmaz, Lankaran-Astara, Shirvan and Nakhchivan) (1 station with only nitrate data).
For the analysis of the current situation, the monitoring stations were divided into different concentration classes based on the average level of the average annual concentrations for the years 2016-2017. All stations containing data from 2016-2017 were included in the analysis, regardless of the number of years for which data were obtained during the given time period. The results are divided by different regions.
Gap filling methodology
Gaps up to three years are filled by linear interpolation. The values at the beginning and end of the time series are extrapolated by obtaining up to three years of the first or last values, respectively. Missing time series of more than three consecutive years during the time period are not included.
Methodological references
- ISO 5815-2: 2003 - Environmental protection and environmental management. Analytical control and monitoring. Water quality. Determination of biochemical oxygen consumption (BOTn) after N days. Part 2. A method applied without rinsing the samples.
- ISO 6777:1984 - Water quality - determination of nitrites. Molecular absorption spectrometric method. Determines the method for drinking, technical and waste water. A list of the effects of other substances on the outcome is provided in the Appendix. As standard nitrite solutions can be unstable, the concentration of these solutions should be checked by the given procedure.
- EEA, 2005. Guide to the EEA core set of indicators. EEA Technical report No. 1/2005, ISBN 92-9167-757-4, Luxembourg.
- UNECE, 2018. Guidelines for the Implementation of Environmental Indicators, Description of C10. Biochemical Oxygen Demand (BOT) and ammonium concentration in rivers.
- UNECE, 2018. Guidelines for the Application of Environmental Indicators, Glossary - C10. Biochemical Oxygen Demand (BOT) and ammonium concentration in rivers.
- UNSD and UNEP, 2013. Environmental Statistics Survey 2013. United Nations Statistics Division and United Nations Environment Programme, Environmental Statistics Survey 2013, Water Division.
Uncertainties
Methodological uncertainties
No ambiguity was detected.
Uncertainties in data
No ambiguity was detected.
Ambiguities in reasoning
No ambiguity was detected.
Information sources
-
The information was provided by the National Environmental Monitoring Department of the Ministry of Ecology and Natural Resources within the framework of the activities of the ENI SEIS II East project.
Metadata
Themes: water
Indicator code: C11
Tags: water quality, nutrients, Azerbaijan
Time period covered: 2001-2017
DPSIR: Pressure
Typology: descriptive indicator (Type A - what is happening to the environment and people?)
DatesPublication date:
Last modified:
Frequency of updates: every year
Contact information and ownershipCoordinator:
Ownership: Ministry of Ecology and Natural Resources of the Republic of Azerbaijan
Related content
Short term work
Modernization and certification of existing laboratories, capacity building and prioritization, preparation of river basin management plans, establishment and management of electronic databases.
Long term work
Achieving integrated management of water resources through the implementation of the National Water Strategy.
